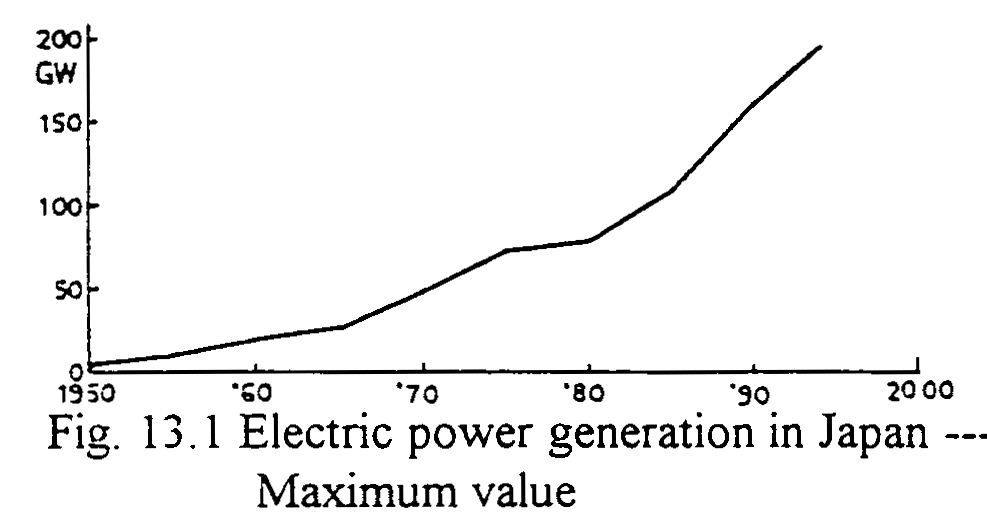
Fig. 13.1 shows the Japanese history of the electric power generation and Table 13.1 possible transmission power vs. voltage. The power demand is still increasing.

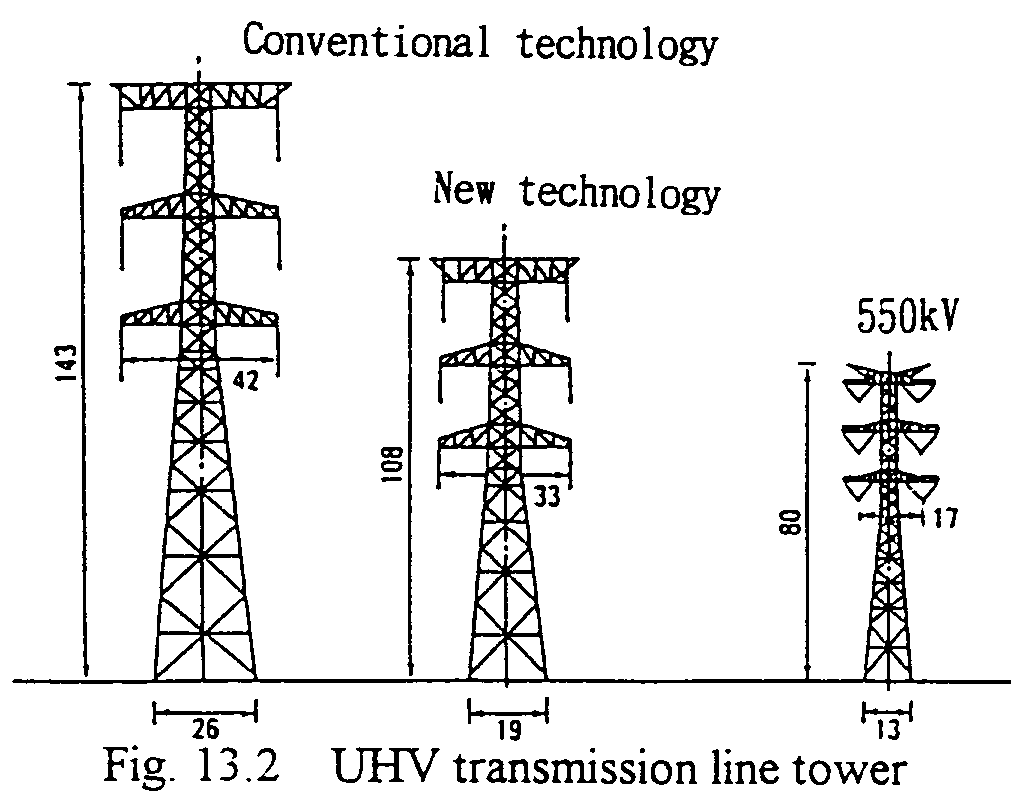
Applying the new technology of insulation coordination mentioned in the followings, the dimension of UHV transmission line tower can be only 130% of EHV(500kV) as shown in Fig.13.2.

In Table 13.1 some examples of transmission power limits by some voltages of lines are shown, where the assumptions are introduced.:
* For line reactances, positive sequence parameters of one circuit of lines are introduced.
** The possible transmission powers are calculated by the equation,:
-
P=0.5E2/X
From these, especially considering the necessary ground area for the transmission lines, the demand for the UHV transmission is clear.
Table 13.1 Possible transmission power vs. voltage (150km line)
| SHV | SHV | EHV | EHV | UHV | |
| Nominal voltages | 66kV | 154kV | 275kV | 500kV | 1000kV |
| Line consts.* | |||||
| 1 mH/km | 1,3 | 1,3 | 0,96 | 0,86 | 0,80 |
| X W/150km | 61, | 61, | 45, | 40, | 38, |
| Max. transm. power MW** | 36, | 195, | 840, | 3.125, | 13.158, |